
The latest TRREB Market Watch report for October 2026 shows a GTA housing market with fewer sales and fewer homes available compared to last year. While home sales declined 7.9%, new and active listings fell at a faster pace, reducing available supply.
The average GTA home price remained below last year’s level at $1,024,108, highlighting the importance of a local strategy for buyers and sellers.
GTA Home Sales Decline in October
GTA REALTORS® reported 5,603 home sales in October 2026, down 7.9% compared to 6,083 sales in October 2025.
Although transactions were lower, new listings declined more sharply than sales. This means fewer properties entered the market relative to the pace of buying activity.
However, conditions continue to vary across neighbourhoods, property types and price ranges.
New and Active Listings Fall
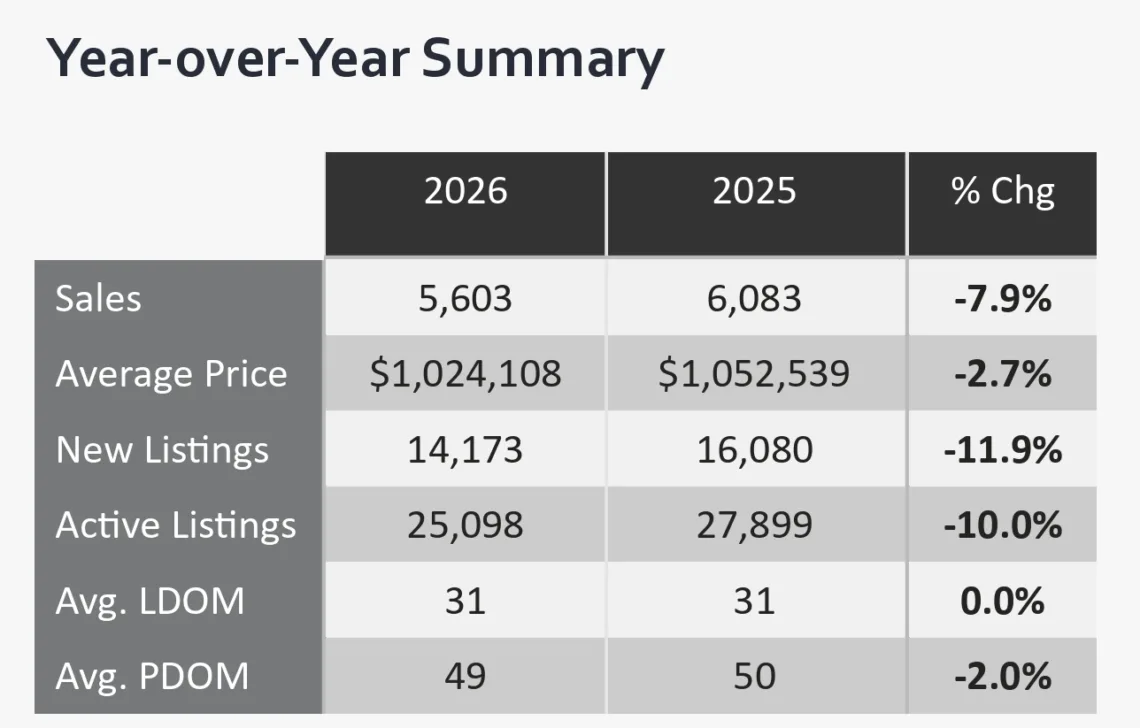
One of October’s key changes was the decline in both new listings and the total number of homes available for sale.
• 5,603 sales — down 7.9%
• 14,173 new listings — down 11.9%
• 25,098 active listings — down 10.0%
• Average price: $1,024,108 — down 2.7%
• Median price: $860,000
• Average LDOM: 31 days
• Average PDOM: 49 days
New listings decreased from 16,080 in October 2025, while active listings fell from 27,899.
For buyers, this means fewer available options than a year ago. For sellers, it may mean fewer competing properties, although pricing and presentation remain important in a market with lower sales activity.
Average GTA Home Price Remains Below Last Year
The average selling price across the GTA was $1,024,108, down 2.7% year over year from $1,052,539 in October 2025.
That represents a difference of $28,431 compared to last October. Meanwhile, the median selling price was $860,000.
These figures provide a broad view of the market. However, the value of an individual property depends on its location, condition, home type and recent comparable sales.
Buyers and sellers should look closely at their specific neighbourhood before making pricing or offer decisions.
Toronto and York Region Market Highlights
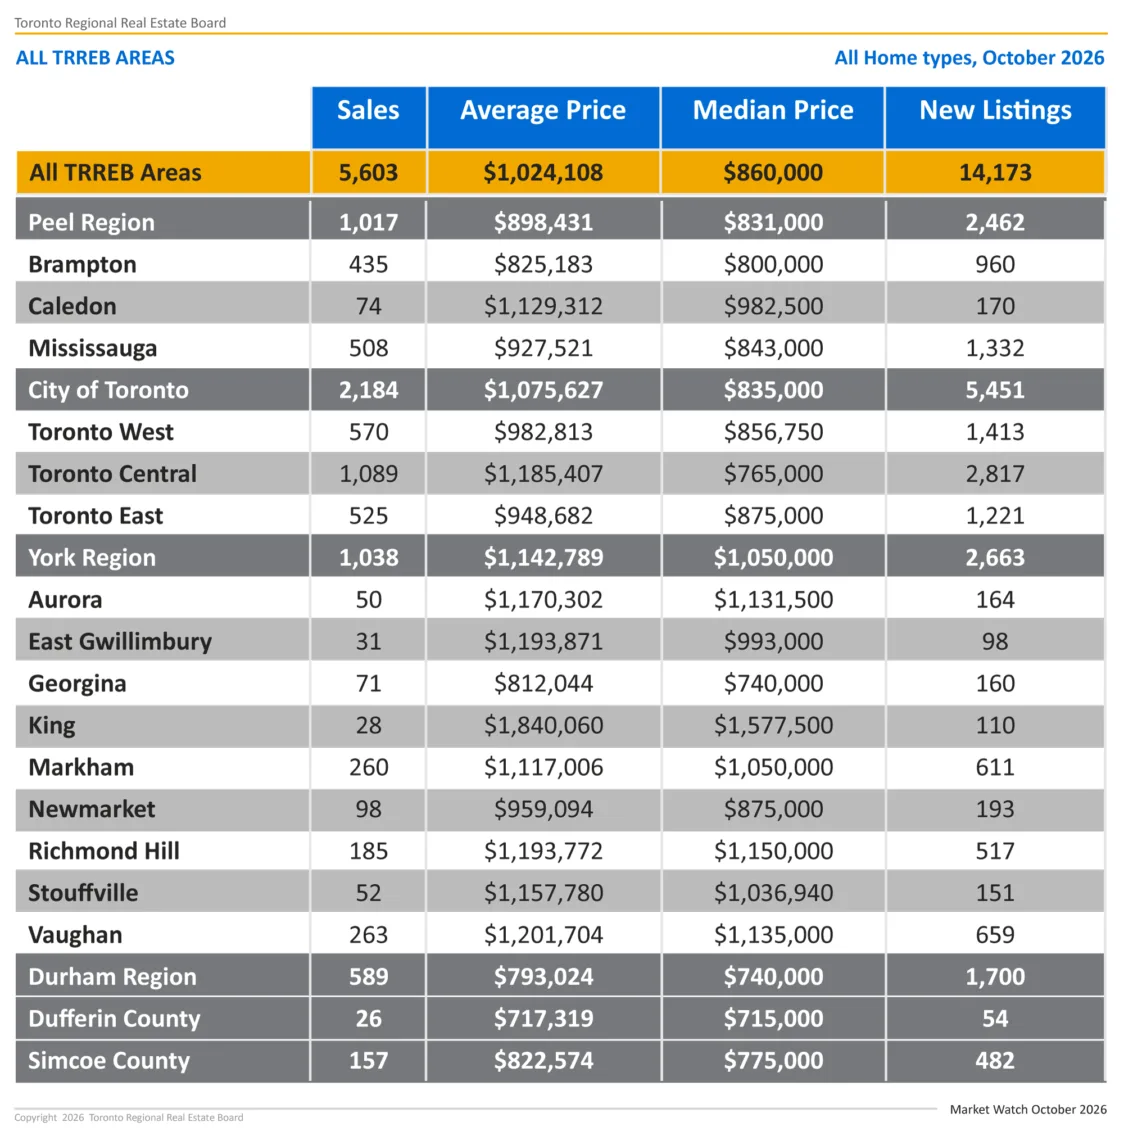
The City of Toronto recorded 2,184 sales, with an average selling price of $1,075,627 and 5,451 new listings.
Across the city, average prices varied considerably. Toronto Central recorded an average of $1,185,407, compared to $982,813 in Toronto West and $948,682 in Toronto East.
York Region recorded 1,038 sales, with an average selling price of $1,142,789 and 2,663 new listings.
October 2026 Highlights
Richmond Hill: $1,193,772
Vaughan: $1,201,704
Markham: $1,117,006
Aurora: $1,170,302
Newmarket: $959,094
Stouffville: $1,157,780
King: $1,840,060
These average selling prices highlight the differences between communities. The mix of properties sold each month can also influence local averages, making neighbourhood-level comparisons especially useful.
What This Means for Buyers
The TRREB Market Watch October numbers show average prices below last year’s levels, alongside fewer available listings.
Buyers may find opportunities, but the right approach depends on the home and its local market. Reviewing recent comparable sales, competing listings and time on market can help you make a well-informed offer.
Having financing in place and a clear budget can also help you act confidently when a suitable property becomes available.
What This Means for Sellers
For sellers, fewer active listings may mean less competition from other homes on the market. However, the decline in sales means attracting serious buyers still requires a thoughtful approach.
Average listing days on market remained unchanged at 31 days, while average property days on market decreased slightly from 50 to 49 days.
Accurate pricing, strong presentation and professional marketing remain essential. A strategy based on recent local sales can help position your property effectively.
GTA Housing Market Continues to Adjust
October’s results show a market with fewer sales, fewer listings and lower average prices compared to last year.
Although supply declined faster than sales, these figures alone do not establish that competition or prices are increasing. Local inventory and buyer activity remain key factors to watch.
Whether you’re buying, selling or investing, understanding conditions in your neighbourhood can help you plan your next move with greater confidence.
Thinking About Buying or Selling?
The Daryl King Team helps buyers, sellers and investors navigate changing real estate conditions across Toronto and the GTA.
Whether you’re planning your next move or want to understand what your property could be worth in today’s market, our experienced team is here to help.
Contact Us
Build the knowledge needed to move through the real estate market with confidence